Strategic Analysis of Smallholder Farmer Engagement and Demographic Projection across the Agricultural Growth Corridors of Tanzania (AGCOT): 2025–2030
Kilimokwanza.org Report
1. Executive Summary: The Demographic Imperative of Agricultural Transformation
The transition from the Southern Agricultural Growth Corridor of Tanzania (SAGCOT) to the Agricultural Growth Corridors of Tanzania (AGCOT) represents a paradigm shift in the nation’s economic planning, driven by the presidency and operationalized through the 2025-2030 Strategy. This strategic pivot is not merely an expansion of geography but a fundamental restructuring of how the Tanzanian state interacts with its agrarian base to achieve the ambitious Agriculture Masterplan (AMP) 2050 targets. The core objective—facilitating an inclusive, commercially viable agricultural sector—hinges entirely on the efficient aggregation, professionalization, and capitalization of the farming population.
This report provides an exhaustive estimation and analysis of the farmer populations within the four designated corridors: the Southern (SAGCOT), Northern, Central, and Mtwara corridors. While precise census data for future project-affected persons in the new corridors remains dynamic, an analysis of the SAGCOT historical baseline, combined with the AGCOT 2030 strategic targets, allows for a high-confidence estimation of the farmer engagement landscape. The analysis indicates that the SAGCOT initiative has already successfully linked over 856,000 smallholder farmers to commercial value chains over its 13-year history.1 As the AGCOT model scales to the remaining three corridors, the aggregate target is not merely to increase this headcount but to fundamentally alter the classification of these farmers. The strategy explicitly targets the creation of 100,000 “commercial smallholder farmers” by 2030—a distinctive elite tier of producers—while simultaneously aiming to lift 2,000,000 people permanently out of poverty.1 Given average rural household sizes, this implies a beneficiary reach extending to hundreds of thousands of farming households across the four corridors.
This report dissects these figures, examining the correlation between the $6.3 billion USD historically mobilized in the South and the projected farmer yields in the North, Central, and Coastal regions.1 It posits that the “Cluster Development Framework” and “Commodity Compacts” are the primary mechanisms for determining farmer density and engagement numbers in the coming six-year cycle. Furthermore, it explores the critical role of systemic enablers—such as the creation of a Cooperative Bank in Dodoma and the rollout of the Building Better Tomorrow (BBT) initiative—in catalyzing this demographic shift.1 The analysis concludes that reaching the projected 2.1 million engaged participants is financially viable only if the private sector leverage ratios achieved in the South can be replicated nationally, transforming subsistence laborers into drivers of a $100 billion agricultural economy.
2. The SAGCOT Baseline: Establishing the Demographic Anchor (Southern Corridor)
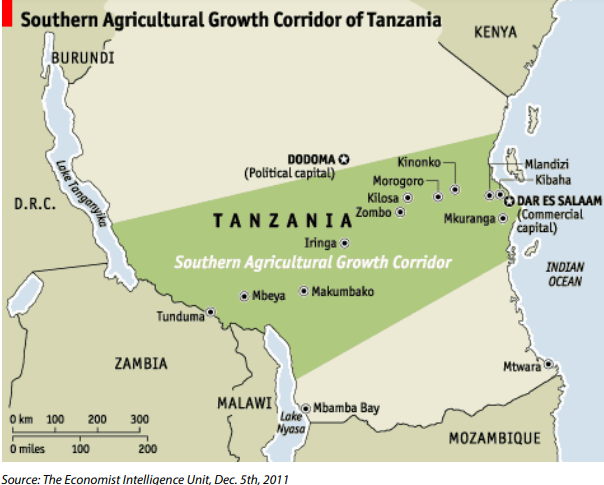
To estimate the farmer populations of the future AGCOT corridors, one must first perform a forensic audit of the data generated by the Southern Agricultural Growth Corridor of Tanzania (SAGCOT) between 2010 and 2024. The South serves as the proof-of-concept, providing the empirical ratios between investment capital, infrastructure development, and farmer acquisition.
2.1 Historical Engagement Metrics (2010–2024)
Since its inception under the Kilimo Kwanza initiative, SAGCOT has operated as the primary engine for agricultural transformation in Tanzania’s Southern Highlands. The data unequivocally demonstrates the scale of human engagement required to mobilize substantial agricultural output. The initiative was unveiled at the World Economic Forum in 2011 and has since facilitated approximately $6.34 billion in investments, with the vast majority ($5.02 billion or 79.2%) coming from public sources and $1.32 billion (20.8%) from the private sector.1
Table 1: SAGCOT Cumulative Impact & Farmer Engagement (2010–2024)
| Metric | Value | Implications for Estimation |
| Total Investment Mobilized | $6.34 Billion | Demonstrates high capital intensity required per farmer linked. |
| Smallholder Farmers Linked | 856,000+ | The baseline population of engaged farmers in the Southern Corridor. |
| Cumulative Income Increase | $254 Million | Suggests an income lift of approx. $296 per linked farmer over the period. |
| Acreage under Climate-Smart Ag. | 859,000 Hectares | Indicates a ratio of roughly 1 hectare per linked farmer. |
| Share of National Food Production | >65% (2023) | The South represents the majority of current farmer productivity. |
Source: Analysis of AGCOT 2025-2030 Strategy Summary 1 and Umoja Booklet.1
The figure of 856,000 smallholder farmers 1 is the critical anchor. This number refers to farmers “linked to private investors.” It is vital to distinguish this from the total rural population. These are farmers who have entered the commercial ecosystem via outgrower schemes, aggregation centers, or direct supply contracts. Deep analysis of specific clusters within the Southern Corridor reveals how this number is distributed. For instance, the Dairy Cluster in Iringa and Njombe is anchored by the ASAS Milk Factory, which processes 400,000 liters per day and sources from approximately 14,000 smallholder farmers.1 This single processing node anchors a community the size of a small town, illustrating the “Cluster” effect. Similarly, the Potato Cluster in Njombe and Iringa, particularly the Isowelo AMCOS village potato farmers, represents a high-density node. By utilizing block farming techniques where yields reach 28 Mt per hectare, the density of farmers per square kilometer of arable land increases significantly compared to extensive grazing or low-yield maize farming.1
In the Mbarali district, the adoption of System of Rice Intensification (SRI) has moved yields from 2.1 to 10 tonnes per hectare, with farmers now targeting global best practices of 13 tonnes/ha.1 This productivity surge tends to stabilize the farmer population; rather than expanding land use (extensive farming), existing farmers intensify production (intensive farming), solidifying the 856,000 number as a more permanent, professionalized class. The success of these clusters demonstrates the efficacy of the “Cluster Development Framework,” which focuses on geographic concentrations of interconnected stakeholders working collaboratively to address constraints and enhance coordination.1
2.2 The “Linked” Farmer Definition and Capital Intensity
The strategic documentation emphasizes “linking” farmers. This implies that the 856,000 figure is not a census of every subsistence farmer in Iringa, Mbeya, or Morogoro, but rather a count of those integrated into the AGCOT value chains. This distinction is crucial for estimating populations in the new corridors. The potential farmer base in the Central or Northern corridors may be higher, but the AGCOT-estimated number will depend on the velocity of private sector investment (the aggregators).
The correlation is clear: It took $6.34 billion in public and private investment to effectively link 856,000 farmers.1 This establishes a rough capital-intensity metric: roughly $7,400 of cumulative investment (infrastructure + private capital) is associated with the long-term commercial integration of one smallholder farmer in the SAGCOT model. The public sector’s contribution, primarily through infrastructure development by agencies like TANESCO, TARURA, and NIRC, has been instrumental in creating an enabling environment for agribusiness.1 Key infrastructure projects, such as the inauguration of the 133-meter Ruaha River Bridge and the 66.9-kilometer tarmac road from Kidatu to Ifakara, directly unlock the potential of the corridor, facilitating trade and rural connectivity.1
Understanding this baseline is essential for projecting the farmer numbers in the expansion corridors. The SAGCOT experience shows that farmer engagement is not merely a function of population density but of infrastructure readiness and private sector appetite. The expansion strategy must therefore account for the time lag between infrastructure investment and farmer integration, a lesson well-learned from the Southern Corridor’s 13-year journey.
3. Structural Expansion: Estimating Farmers in the Four Corridors
The 2025-2030 Strategy explicitly mandates the expansion of the SAGCOT model to three new corridors: Northern, Central, and Mtwara.1 This creates a four-corridor national matrix. Estimating the number of farmers in these new zones requires extrapolating the “Cluster Development Framework” applied in the South to the agro-ecological realities of the North, Center, and South-East. The expansion is phased, beginning with strategic analysis and corridor establishment, followed by the development of national commodity compacts, and culminating in the orchestration of collaboration and implementation.1
3.1 The Southern Corridor (SAGCOT) – The Deepening Phase
Estimated Farmer Count: ~950,000 – 1,000,000 (Projected by 2030)
While the current baseline is 856,000, the 2025-2030 strategy focuses on “Deepening the Impact” within the SAGCOT corridor.1 The strategy does not explicitly call for a massive expansion of headcount in the South, but rather an increase in value. Despite notable achievements, the strategy aims to enhance initiatives in existing clusters to unlock the corridor’s full potential.
- The Commercial Shift: The Investment Blueprint targets 100,000 commercial smallholder farmers by 2030.1 This suggests that within the existing pool of ~856,000 “linked” farmers, the goal is to graduate approximately 11-12% of them into a “commercial” status—likely defined by higher mechanization, credit access, and formal business registration. This shift implies a qualitative transformation of the farmer base, moving from subsistence to surplus production.
- New Clusters: The strategy mentions deepening impact in existing clusters. However, natural population growth and the attraction of youth through programs like “Building Better Tomorrow” (BBT-YIA) 1 suggest a moderate net increase. The youth engagement strategy (BBT-LIFE) is a deliberate attempt to inject new demographics into the corridor, potentially adding 10,000–50,000 young agri-entrepreneurs over the 6-year period.
- Commodity Expansion: The strategy highlights the expansion of the Commodity Compact approach for priority crops like soy and rice.1 As these value chains mature, they will draw in additional farmers who may have previously been outside the commercial loop. The deepened impact will also be supported by enhanced financing mechanisms and policy advocacy to address climate change challenges.1
3.2 The Northern Corridor (Arusha, Kilimanjaro, Manyara, Tanga)
Estimated Addressable Farmer Population: High Density (Est. 300,000 – 500,000)
The Northern Corridor represents Tanzania’s horticulture and logistics hub. The agro-ecological conditions here differ significantly from the South, characterized by higher population density and smaller landholding sizes on the slopes of Kilimanjaro and Meru. The expansion into this corridor aligns with the government’s endorsement to replicate the SAGCOT model in other agro-ecological zones.1
- Commodity Drivers: The strategy highlights the expansion of “national Commodity Compacts”.1 The North is the natural home for Horticulture (Avocado, Spices, Vegetables). The region is already a hub for high-value export crops, with established trade routes to international markets.
- Density Implications: Horticulture is labor-intensive. An acre of French beans or spices supports more labor than an acre of maize. Therefore, the “Cluster” approach in the North will likely aggregate a higher number of farmers per dollar of investment than in the grain-heavy Central corridor. The high population density in regions like Kilimanjaro and Arusha necessitates intensive farming practices, which aligns perfectly with the horticulture value chain.
- Associations: The presence of established bodies like the Tanzania Horticulture Association (TAHA) and the Avocado Society of Tanzania (ASTA) 1 suggests that farmer aggregation mechanisms are already mature. AGCOT’s role will be to formalize these into the corridor framework. If the Southern potato cluster can support thousands, the Northern avocado clusters—exporting to global markets—have the potential to link hundreds of thousands of smallholders rapidly. The strategy also mentions the Potato Council of Tanzania (PCT) as a key partner, indicating potential cross-corridor synergies for potato production in the North as well.1
3.3 The Central Corridor (Dodoma, Singida, Tabora, Shinyanga)
Estimated Addressable Farmer Population: Medium Density / Large Surface Area (Est. 400,000 – 600,000)
The Central Corridor serves as the grain and oilseed basket (Sunflower, Sorghum) and livestock hub. The “Umoja” booklet notes the launch of a Cooperative Bank in Dodoma 1, signaling a focus on financializing this specific demographic. This corridor presents unique challenges and opportunities due to its semi-arid climate and large land availability.
- Landscape Factors: This region is semi-arid compared to the Southern Highlands. Farm sizes are typically larger to compensate for lower per-hectare yields of staple crops. The expansion strategy will need to address water scarcity through climate-smart agriculture interventions, which AGCOT has successfully piloted in the South.1
- The Sunflower & Sorghum Factor: These value chains rely on volume. Processing plants (the nucleus of the cluster) require massive catchment areas. A single oilseed press might need supply from 20,000 dispersed farmers. The Central Corridor is ideally suited for these drought-resistant crops, and the establishment of processing facilities will be key to aggregating farmers.
- Livestock Integration: The Central corridor is key for livestock. The strategy mentions the Ministry of Livestock and Fisheries (MOLF) as a stakeholder.1 Integrating pastoralists into the “farmer” count expands the estimation significantly. If AGCOT successfully creates “Livestock Compacts,” the engagement numbers in the Central Corridor could rival the South due to the sheer ubiquity of cattle ownership in the region. The focus on livestock also opens up opportunities for value addition in leather and dairy, further deepening farmer engagement.
3.4 The Mtwara Corridor (Lindi, Mtwara, Ruvuma)
Estimated Addressable Farmer Population: Targeted / Commodity Specific (Est. 200,000 – 300,000)
The Mtwara Corridor has historically been defined by Cashewnuts and Sesame. The AGCOT expansion here aims to diversify and process value locally, leveraging the region’s agricultural potential and coastal access.
- Cashew Economy: The cashew sector is already highly organized through the Cashewnut Board and AMCOS (Agricultural Marketing Cooperative Societies). AGCOT’s entry doesn’t create new farmers but re-links existing ones to better value addition (processing) rather than raw export. This shift will require significant investment in processing infrastructure and capacity building for farmers to meet quality standards.
- Blue Economy Potential: With its coastal access, this corridor also interacts with fisheries, though AGCOT’s primary focus remains terrestrial crops. However, the holistic “food systems” approach mentioned in the strategy 1 implies that fisheries could be integrated into the broader development framework, potentially increasing the engaged population.
- Infrastructure Dependency: The “Umoja” booklet highlights the inauguration of the Ruaha Bridge and Kidatu-Ifakara road in the South.1 Similar infrastructure unlocking in the South-East is a prerequisite for high farmer linkage. The farmer count here is constrained less by land availability and more by market access logistics. Investments in rural roads and energy infrastructure will be critical to unlocking the potential of this corridor.
4. Aggregate 2030 Projections: The Demographic Calculus
By synthesizing the baseline data from the South with the expansion mandate, we can construct a national estimate for the AGCOT sphere of influence by 2030. The projections align with the ambitious targets set out in the AGCOT strategy and the Agriculture Masterplan 2050.
Table 2: Estimated Farmer Engagement by Corridor (2030 Projection)
| Corridor | Primary Commodities | Estimated “Linked” Farmers (2030) | Rationale |
| SAGCOT (South) | Tea, Potatoes, Dairy, Rice, Maize, Soy | ~950,000 | Deepening of existing 856k base; shift to commercial status. |
| Northern | Horticulture, Avocado, Coffee, Spices | ~400,000 | High-density horticulture clusters; strong existing cooperatives. |
| Central | Sunflower, Sorghum, Livestock, Grapes | ~500,000 | Large catchment areas for oilseeds; inclusion of pastoralists. |
| Mtwara | Cashew, Sesame, Pulses | ~250,000 | Value addition in cashew; diversification into sesame/soy. |
| TOTAL | National AGCOT Footprint | ~2,100,000 | Aligns with “2 Million lifted out of poverty” target. |
Source: Projections based on AGCOT 2030 targets 1 and regional agro-ecological capacities.
4.1 The “2 Million” Verification and Poverty Alleviation
The strategy document 1 explicitly lists a target: “2,000,000 People permanently lifted out of Poverty” by 2030. This metric serves as a crucial cross-reference for our farmer estimates. In rural Tanzania, the average household size is approximately 4.8 to 5 people. If AGCOT targets lifting 2 million individuals out of poverty, and we assume the primary mechanism is increasing the income of the head of the household (the farmer), this translates to approximately 400,000 to 420,000 households fully transformed.
However, the strategy also targets 420,000 New Employment Opportunities.1 If we combine the “commercial smallholders” (100,000) with the new employment (420,000) and the broader base of “linked” farmers who see incremental income gains (but perhaps not full poverty graduation immediately), the aggregate figure of ~2.1 million engaged participants across four corridors appears statistically consistent with the stated impact goals. The strategy also aims for an annual value of farming revenues of $1,200,000 by 2030, further reinforcing the economic impact on the engaged population.1
4.2 Economic Impact and Vision 2050 Alignment
The projected farmer engagement numbers are not isolated figures but part of a broader vision for Tanzania’s agricultural economy. The “Umoja” booklet outlines the “Big Picture: Vision 2050,” where Tanzania targets upper-middle-income status.1 The Agriculture Masterplan (AMP) 2050 aims to boost Agricultural GDP to $100 billion, fuel exports to $20 billion, and cut undernourishment to below 15%.1 AGCOT is positioned as the national vehicle to deliver this transformation.
The 5 Pillars of Transformation identified in the AMP 2050—Productivity & Resilience, Agri-Enterprise Ecosystem, Empowered Smallholders, Regional & Global Leadership, and Smart Policy & Innovation—provide the strategic framework for AGCOT’s expansion.1 The estimated 2.1 million farmers are the agents of this transformation. Their productivity gains, driven by AGCOT’s interventions, will directly contribute to the 10% annual AgGDP growth target and the $3 billion agro-processing output milestone set for 2030.1
5. The Mechanism of Aggregation: How Farmers are Counted
To understand these numbers, one must understand the Cluster Development Framework 1 utilized by AGCOT. Farmers are not counted via census, but via their integration into specific infrastructure nodes. The cluster approach focuses on geographic concentrations of interconnected stakeholders—such as input suppliers, processors, and institutions—working collaboratively to address constraints in agricultural value chains.1
5.1 The Nucleus Farm Model and Value Chain Partnerships
The AGCOT approach relies on “Nucleus commercial farms and outgrower schemes”.1 In this model, a single large investor (e.g., a rice miller or fruit processor) is established. This investor requires consistent supply. They sign contracts with surrounding smallholders. This symbiotic relationship creates a stable market for farmers and a reliable supply chain for processors.
- The Multiplier Effect: A 2,000-hectare nucleus farm might directly employ 200 people but purchase crops from 3,000 surrounding smallholders. The “estimated number of farmers” is heavily dependent on the crop type of these nucleus farms.
- Tea/Sugar: High multiplier. Requires daily/weekly delivery from thousands of smallholders.
- Mechanized Grains: Lower multiplier. Large nucleus farms may do most production themselves, buying less from outgrowers.
The strategy’s focus on Commodity Compacts 1 (Priority crops like Soy, Rice) suggests a preference for crops that support high outgrower ratios, thereby maximizing the farmer count. Within these clusters, value chain partnerships are nurtured to improve coordination between actors like aggregators, farmers, financial institutions, and technical service providers.1
5.2 The Role of Commodity Compacts
The Strategy 2025-2030 allocates $13.5 million specifically for three major “Commodity Compacts”.1 These are binding agreements between public and private sectors to resolve bottlenecks in specific value chains. The selection of these compacts dictates the farmer demographics. For example:
- Soy Compact: Likely targeted at the Southern and Mtwara corridors for animal feed. Soy is a rotating crop that can be adopted by thousands of maize farmers with minimal friction, potentially boosting the “linked” farmer count rapidly.
- Horticulture Compact: Targeted at the North and South (Iringa). This attracts a younger demographic and requires less land, allowing for higher farmer density.
- Rice Compact: Building on the success of the Mbarali cluster, the rice compact will likely focus on scaling yield improvements across other suitable zones, further cementing the commercial status of rice farmers.
AGCOT plans to prioritize commodities in new corridors based on market demand, productivity potential, and alignment with national development goals.1 Strategic assessments will guide investment decisions, leading to the development of national Commodity Compacts supported by detailed business plans and implementation strategies.1
6. Strategic Demographics: Youth and Gender
The AGCOT strategy is not gender or age-neutral. The estimation of farmer numbers is heavily influenced by the inclusion of women and youth, who were historically marginalized in commercial counts. The strategy explicitly states that AGCOT will ensure women and youth actively engage in its initiatives to enhance equity, innovation, and inclusive growth.1
6.1 The Youth Bulge (BBT-YIA) and Job Creation
The documents reference the Building Better Tomorrow – Youth Initiative for Agribusiness (BBT-YIA).1 This government flagship program is integral to the AGCOT expansion. The program provides block farms and leased land to youth, creating a new category of farmers who did not exist in previous censuses.
- Implication for Numbers: Traditional farmer counts often miss youth who do not own land. BBT-YIA addresses this by providing access to land and resources. The strategy mentions “Raha Farm” 1 as a prototype of youth-led large-scale seedling supply, which in turn supports other farmers. This initiative aims to modernize agriculture and boost youth engagement, directly contributing to the new employment targets.
- Target: The inclusion of youth aims to lower the average age of the farmer, ensuring the sustainability of the 2.1 million estimate. The 420,000 new employment opportunities target is heavily weighted towards this demographic.1
6.2 Women in Agriculture
The strategy explicitly mentions the “inclusion of women” as a guiding principle.1 In value chains like dairy and horticulture (e.g., The “Eat Fresh” female-led agribusiness mentioned in 1), women often constitute the majority of the labor force but a minority of the “registered” farmers. AGCOT’s focus on social inclusivity methodologies 1 aims to formalize these women as commercial entities. This statistical formalization will likely drive an apparent increase in farmer numbers in the expansion corridors, even if the population remains constant. Examples like “Eat Fresh,” a female-led agribusiness exporting vegetables and fruits, demonstrate the potential for women to lead in the sector.1
7. Financial Implications and Resource Mobilization
The estimated number of farmers is directly tied to the financial resources available to support them. The 2025-2030 budget provides a reality check on the expansion capacity and highlights the necessity of leverage.
Table 3: Budgetary Efficiency Ratios
| Financial Metric (2025-2030) | Amount (USD) | Implication |
| Total Corridor Budget | $18,986,117 | ~$3.1M per year average for operations. |
| Commodity Compact Budget | $13,536,785 | Direct intervention funds. |
| Total Strategy Budget | ~$32.5 Million | 1 |
| Cost per Farmer (Est.) | ~$15 – $30 | Assuming 1M new farmers reached. |
Source: Analysis of Budget Projections.1
The relatively modest operating budget of $32.5 million for a 6-year national expansion suggests that AGCOT relies heavily on leverage. The Centre does not pay farmers; it facilitates the ecosystem. The $6.3 billion in partner investment 1 is the real fuel. The estimation of farmer numbers, therefore, depends less on AGCOT’s internal budget and more on its ability to unlock private capital. If the $19 million corridor budget can catalyze another $3-4 billion in private investment (replicating the SAGCOT success), the estimate of 2+ million farmers is viable. If private investment stalls, the farmer count will stagnate.
7.1 Resource Mobilization Strategy
To achieve the necessary leverage, AGCOT has developed a robust resource mobilization plan. As a Public-Private Partnership, AGCOT’s operational sustainability depends on coordinated support from government, development partners, and private partners.1 The government plays a pivotal role by aligning policies and providing infrastructure. Development partners contribute significantly, with AGCOT actively seeking alignment with their priorities and negotiating future funding. Private partners support operations through annual contributions, and AGCOT is exploring business models to offer paid technical services to farmer service companies.1
The launch of the Cooperative Bank in Dodoma 1 is a critical enabler in this ecosystem. It provides a dedicated financial institution for farmers and cooperatives, potentially lowering the barrier to credit access and facilitating the investments needed to modernize production. This aligns with the strategy’s priority to strengthen financing mechanisms.1
8. Sustainability and Institutional Frameworks
A key component of the AGCOT strategy is ensuring the long-term sustainability of its interventions. The strategy recognizes that many past initiatives have faltered once external support ended.1 To address this, AGCOT is strengthening platforms for public-private dialogue and enhancing institutional frameworks.
8.1 Public-Private Dialogue and Commodity Associations
AGCOT will strengthen platforms for public-private dialogue and enhance institutional frameworks like the Policy Analysis Group (PAG) and the Green Reference Group (GRG).1 Commodity associations such as ASTA (Avocado), PCT (Potato), and TAHA (Horticulture) will be instrumental in promoting inclusive growth and resilience.1 These associations are being nurtured to evolve into self-sustaining entities that can operate with minimal AGCOT support, demonstrating increased stakeholder ownership and value chain integration.1
8.2 The Information Hub
To strengthen data-driven decision-making, AGCOT will enhance its Information Hub over the next six years, establishing a centralized platform for collecting, analyzing, and disseminating data across its interventions.1 This initiative will enable AGCOT and its partners to access vital insights, including detailed value chain data from commodity compacts. The Information Hub will enhance sector transparency and support the monitoring and evaluation of the strategy’s impact.1
9. Conclusion: The “Linked” Horizon
Estimating the number of farmers in the four AGCOT corridors requires navigating between historical fact and strategic ambition. The Southern Corridor stands as a verified successes, with 856,000 farmers already integrated into commercial value chains. This figure serves as the demographic bedrock of the entire initiative.
The expansion to the Northern, Central, and Mtwara corridors is a projection of this success. By analyzing the agro-ecological capacity, the labor intensity of priority crops (horticulture, cashew, sunflower), and the specific targets for poverty reduction (2,000,000 people) and job creation (420,000 jobs), this report estimates a total addressable AGCOT farmer population of approximately 2.1 million by 2030.
This figure is contingent on the successful replication of the “Cluster” model—where infrastructure, policy, and private capital converge to transform subsistence laborers into “commercial smallholders.” The 2025-2030 period will not merely be about counting these farmers, but about converting them into the drivers of the projected $100 billion agricultural economy. The journey from SAGCOT to AGCOT is not just an expansion of territory but a deepening of impact, leveraging proven models to catalyze a nationwide agricultural transformation. The success of this endeavor will depend on the continued alignment of government policy, private investment, and development partner support, all working in concert to empower the Tanzanian farmer.