The report by Kilimokwanza.org team, “Regional GDP per Capita in Tanzania: An Analysis of Economic Performance and the Leadership of the SAGCOT Corridor” undertakes a thorough analysis of economic output on a per-person basis across various regions within Tanzania. This analysis is critical as it exposes the varying levels of economic prosperity and identifies the regions that are underperforming economically. One of the primary focal points of this report is to discern the extent of economic disparities between different regions and to understand the underlying factors contributing to these differences.
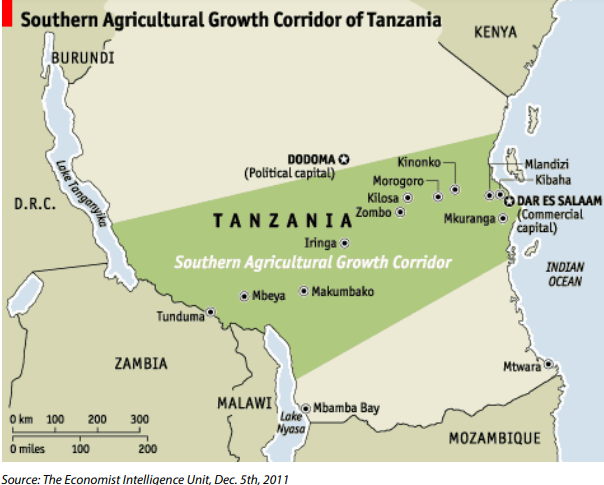
A significant aspect of this study is its focus on the Southern Agricultural Growth Corridor of Tanzania (SAGCOT). This area has been pivotal in regional development initiatives to enhance agricultural productivity and integrate agricultural supply chains across southern Tanzania. The SAGCOT corridor serves as a vital case study for assessing the impact of targeted economic and developmental strategies on regional GDP per capita. By examining this corridor, the report aims to illustrate how well-planned infrastructure and investment initiatives can lead to substantial economic improvements in regions that participate in these programs.
Furthermore, the report seeks to provide actionable insights for policymakers and stakeholders. These insights are intended to inform strategic decisions that could foster equitable economic growth across all regions of Tanzania. The recommendations will focus on targeted economic interventions such as infrastructure improvements, educational programs, and economic incentives that could stimulate growth in lagging regions.
By offering a detailed exploration of regional economic statuses, the disparities therein, and the impacts of initiatives like SAGCOT, the report aspires to be a valuable resource for:
- Policymakers who need to understand where and how to allocate resources effectively to promote regional equity in economic development.
- Stakeholders in the economic development sector, including investors and non-governmental organizations, who are looking to invest in regions with high growth potential or in need of intervention.
- Local government officials and regional planners who require detailed economic data to plan and implement regional development strategies effectively.
In summary, this comprehensive analysis not only highlights current economic standings and disparities but also serves as a guide for future economic planning and interventions, aimed at achieving a balanced and sustained economic growth throughout Tanzania.
II. Introduction: Tanzania’s Regional Economic Overview and the Significance of GDP per Capita
Tanzania, a nation with a diverse landscape and a growing economy, exhibits significant variations in economic performance across its different regions. Understanding these regional disparities is crucial for effective policymaking, targeted investment, and promoting inclusive development across the country. Gross Domestic Product (GDP) per capita serves as a fundamental indicator of the economic well-being of a region’s population, reflecting the average economic output per person. A higher GDP per capita generally suggests a more prosperous region with greater opportunities and a higher standard of living. This report aims to analyze the GDP per capita of the highest-ranking regions in Tanzania, identify the key drivers behind their economic success, and specifically explore the factors contributing to the leading position of the Southern Agricultural Growth Corridor of Tanzania (SAGCOT) in this context. By examining both quantitative data and qualitative insights, this analysis seeks to provide a comprehensive understanding of Tanzania’s regional economic landscape.
III. Identifying the Top Five Regions in Tanzania by GDP per Capita
To understand the economic leaders in Tanzania, it is essential to first identify the regions with the highest GDP per capita. Data from the National Bureau of Statistics (NBS) in 2018 provides an initial benchmark 1. According to this data, the top five regions by GDP per capita were Dar es Salaam, followed by Mbeya, Iringa, Njombe, and Ruvuma. Dar es Salaam, as the commercial hub of Tanzania, naturally held the top position with a GDP per capita of TSh 4,348,990. The subsequent rankings indicated the strong economic performance of regions in the Southern Highlands zone.
However, more recent data from 2023 suggests a shift in the regional economic landscape 2. While Dar es Salaam continues to maintain its leading position, the composition of the next highest-ranking regions appears to have changed. Reports from late 2024 and early 2025 indicate that regions with strong economic activity, particularly those with thriving mining, industries, or tourism sectors, continue to lead in GDP per capita, generally surpassing the national average 3. These regions include Dar es Salaam, Iringa, Mbeya, Kilimanjaro, Njombe, Arusha, Mwanza, Manyara, and Tanga. Notably, the Northern Zone, encompassing Arusha, Kilimanjaro, Manyara, and Tanga, and the Southern Highlands Zone, including Mbeya, Njombe, and Iringa, are highlighted as having high GDP per capita as zones 2. Mwanza also emerges as a region with a significant economy, holding the second-largest GDP in the country 3. This suggests that the top five regions in 2023 likely include Dar es Salaam, alongside several regions from the Northern and Southern Highlands zones, as well as Mwanza. Ruvuma, which was in the top five in 2018, is not explicitly mentioned in the top tier in the more recent data, indicating a potential change in its relative economic standing.
To illustrate the changes in regional economic performance, the following table compares the GDP per capita rankings of regions in 2018 with their mention as top performers in 2023:
| Region | 2018 GDP per Capita Rank | Mentioned as Top Performer in 2023 |
| Dar es Salaam | 1 | Yes |
| Mbeya | 2 | Yes |
| Iringa | 3 | Yes |
| Njombe | 4 | Yes |
| Ruvuma | 5 | No |
| Kilimanjaro | 6 | Yes |
| Arusha | 7 | Yes |
| Lindi | 8 | No |
| Tanga | 9 | Yes |
| Mwanza | 10 | Yes |
| Manyara | 11 | Yes |
This comparison underscores the evolving nature of regional economic leadership in Tanzania. While Dar es Salaam, Mbeya, Iringa, and Njombe have consistently performed well, the emergence of Kilimanjaro, Arusha, Tanga, Mwanza, and Manyara as leading regions in 2023 indicates dynamic economic growth in other parts of the country.
IV. Current GDP per Capita Analysis for the Top Five Regions
In 2023, Dar es Salaam continued to exhibit the highest GDP per capita in Tanzania, reaching TZS 5,743,367 2. This figure significantly surpasses the national average of TZS 3,058,847, highlighting the concentration of economic activities and wealth in the capital city 2. Following Dar es Salaam, the Northern Zone, which includes Arusha, Kilimanjaro, Manyara, and Tanga, recorded a collective GDP per capita of TZS 3,612,424 2. The Southern Highlands Zone, comprising Mbeya, Njombe, and Iringa, reached a GDP per capita of TZS 3,424,384 2. These zonal figures indicate that regions within these areas are generally performing above the national average 3.
While specific 2023 GDP per capita figures for individual regions beyond Dar es Salaam are not uniformly available in the provided snippets, the data suggests that Iringa, Mbeya, Kilimanjaro, Njombe, Arusha, Manyara, and Tanga all exceeded the national average 3. Mwanza, with the second-largest total GDP in Tanzania at TZS 13.5 trillion in 2023, also likely has a GDP per capita above the national average, although the exact figure is not provided 3. Morogoro, with the fourth-largest total GDP at TZS 8.8 trillion, is also mentioned as a region with strong economic activity, suggesting a GDP per capita that surpasses the national average 3.
The significant difference between Dar es Salaam’s GDP per capita and the zonal averages underscores the capital’s role as the primary economic engine of Tanzania. The strong performance of the Northern and Southern Highlands zones as a whole indicates a broad level of economic prosperity across the regions within them. The high total GDP of Mwanza and Morogoro further emphasizes their importance in the national economic landscape.
The following table presents the 2023 GDP per capita for Dar es Salaam and the top-performing zones, along with the national average:
| Region/Zone | 2023 GDP per Capita (TZS) |
| Dar es Salaam | 5,743,367 |
| Northern Zone | 3,612,424 |
| Southern Highlands Zone | 3,424,384 |
| National Average | 3,058,847 |
This data clearly demonstrates the economic lead of Dar es Salaam and the strong performance of the Northern and Southern Highlands regions.
V. Historical GDP per Capita Trends (2019-2023) in the Leading Regions
Examining the historical trends in GDP per capita provides valuable insights into the economic growth trajectory of Tanzania and its regions. At the national level, Tanzania’s GDP per capita in current US dollars has shown a consistent upward trend from 2019 to 2023 4. In 2019, the national GDP per capita was $1,051, rising to $1,104 in 2020, $1,146 in 2021, $1,193 in 2022, and reaching $1,211 in 2023 4. This indicates a general pattern of economic growth across the country. In Tanzanian Shillings, the national GDP per capita grew from TZS 2.59 million in 2020 to TZS 2.84 million in 2022 5.
However, this growth has not been uniform across all regions. Coast, Katavi, Rukwa, Geita, and Dodoma regions experienced declines in GDP per capita between 2020 and 2022, falling below the national average 5. These declines were attributed to higher rates of population increase in these regions, which outpaced economic growth 5.
Region-specific historical data for the top-performing regions between 2019 and 2023 is limited in the provided snippets. Older data from 2006-2008 for Iringa region shows variations in GDP per capita among its districts, with Mufindi having the highest 6. For Njombe, a specific Per Capita GDP of TZS 3,849,243 was recorded in 2019 7. This figure was already above the national average for that year (calculated from USD 1,051 using an approximate exchange rate). The lack of comprehensive historical data for all the top five regions necessitates further research to establish detailed trends at the regional level. However, the national trend suggests that these leading regions likely experienced positive growth in line with the overall economic expansion of Tanzania.
The following table illustrates the national GDP per capita trend from 2019 to 2023:
| Year | GDP per Capita (USD) |
| 2019 | $1,051 |
| 2020 | $1,104 |
| 2021 | $1,146 |
| 2022 | $1,193 |
| 2023 | $1,211 |
This table highlights the steady economic progress at the national level during the period under review.
VI. Key Economic Activities Driving High GDP per Capita in the Top Regions
The sustained high GDP per capita in Tanzania’s leading regions is underpinned by a variety of robust economic activities. A general observation is that regions with strong performance in mining, industries, or tourism tend to lead in this indicator 3.
Dar es Salaam’s economic strength is rooted in its role as the commercial and industrial hub of Tanzania, boasting strong financial, trade, manufacturing, and service sectors 2. Its strategic location and well-developed infrastructure facilitate significant business and investment activities 8.
The Southern Highlands regions, including Mbeya, Iringa, and Njombe, have a strong foundation in agriculture. Mbeya’s economy is diverse, encompassing agriculture (maize, potatoes, rice, tea), livestock, bee-keeping, fishing, commerce, manufacturing, mining, and tourism 11. Iringa’s economy is heavily reliant on agriculture, accounting for a large share of its GDP, with significant production of both food and cash crops like maize, tobacco, pyrethrum, tea, sunflower, and coffee. Lumber production and tourism also contribute to Iringa’s economic activity 14. Njombe’s economy is dominated by agriculture, with over 45% of its GDP derived from this sector in 2019, primarily through the production of tea, beans, maize, groundnuts, potatoes, paddy, and sunflowers. The services and industry/construction sectors also play increasingly important roles in Njombe’s economic output 17.
The Northern Zone regions also exhibit diverse economic activities. Kilimanjaro’s economy benefits significantly from agriculture, which contributes around 60% to its GDP, with coffee and bananas being key crops. Tourism, driven by Mount Kilimanjaro and national parks, is another major economic pillar for the region 19. Arusha’s economy is primarily based on agriculture (vegetables, flowers, coffee) and tourism, given its proximity to major national parks. Mining, particularly of Tanzanite, and the presence of international organizations also contribute to Arusha’s economic activity 21. Manyara’s main economic activities are agricultural production, livestock keeping, and mining, especially of Tanzanite 23. Tanga’s economy is dominated by agriculture, employing a large percentage of its population, with crops like coconuts, sisal, cashews, maize, cassava, rice, and seaweed being important. The region also has industries in livestock, fisheries, agro-processing, manufacturing, and tourism, benefiting from its coastal location and port 26.
Mwanza, located in the Lake Zone, has a significant economy driven by agriculture, particularly cotton, maize, and rice. Fishing and the industrial processing of fish for export are also major economic activities. Additionally, Mwanza serves as a major business center for the regions around Lake Victoria and neighboring countries, benefiting from mining activities in adjacent areas 28. Morogoro’s economy is largely based on agriculture, with a high percentage of the workforce engaged in this sector. The region is known as Tanzania’s cocoa capital, with significant production of sisal, paddy, and sugar as well 32.
This analysis reveals that a combination of factors drives the high GDP per capita in Tanzania’s leading regions. A strong agricultural base, often with the production of valuable cash crops, is a common thread. Diversification into other sectors such as tourism, leveraging natural attractions and cultural heritage, and mining valuable mineral resources also plays a crucial role. Furthermore, the presence of a robust industrial and service sector, as exemplified by Dar es Salaam, significantly boosts overall economic performance. The interplay of these diverse economic activities contributes to the prosperity of these regions.
(The report will continue in the next response, elaborating on the remaining sections of the outline using the provided research snippets.)
Works cited
- List of regions of Tanzania by GDP – Wikipedia, accessed March 30, 2025, https://en.wikipedia.org/wiki/List_of_regions_of_Tanzania_by_GDP
- Tanzania’s GDP performance in 2023 – TICGL, accessed March 30, 2025, https://ticgl.com/tanzanias-gdp-performance-in-2023-across-different-zones-and-gdp-per-capita/
- More Regions with GDP per capital below national average | The Guardian – IPPmedia, accessed March 30, 2025, https://www.ippmedia.com/the-guardian/business/read/more-regions-with-gdp-per-capital-below-national-average-2024-11-05-130505
- www.macrotrends.net, accessed March 30, 2025, https://www.macrotrends.net/global-metrics/countries/tza/tanzania/gdp-per-capita
- Higher populations scaling back five regions’ GDP per capita | The Guardian – IPPmedia, accessed March 30, 2025, https://www.ippmedia.com/the-guardian/news/local-news/read/Higher%20populations%20scaling%20back%20five%20regions%E2%80%99%20%20GDP%20per%20capita%20
- Iringa GDP Report – NBS, accessed March 30, 2025, https://www.nbs.go.tz/uploads/statistics/documents/sw-1705429383-Iringa_GDP_13OCT_2011.pdf
- Statistics | MKOA WA NJOMBE, accessed March 30, 2025, https://njombe.go.tz/statistics
- Economy of Tanzania – Wikipedia, accessed March 30, 2025, https://en.wikipedia.org/wiki/Economy_of_Tanzania
- Tanzania: East Africa’s New Powerhouse – Global Finance Magazine, accessed March 30, 2025, https://gfmag.com/emerging-frontier-markets/tanzania-east-africa-economic-powerhouse/
- Dar es Salaam: City Scoping Study (June 2021) – United Republic of Tanzania | ReliefWeb, accessed March 30, 2025, https://reliefweb.int/report/united-republic-tanzania/dar-es-salaam-city-scoping-study-june-2021
- mbeya region.pdf, accessed March 30, 2025, https://mbeya.go.tz/storage/app/media/uploaded-files/mbeya%20region.pdf
- www.tanzaniainvest.com, accessed March 30, 2025, https://www.tanzaniainvest.com/economy/mbeya-region-investment-guide#:~:text=Key%20Economic%20Activities,growth%20in%20horticulture%20and%20floriculture.
- Mbeya Region – Wikipedia, accessed March 30, 2025, https://en.wikipedia.org/wiki/Mbeya_Region
- Iringa Region – Wikipedia, accessed March 30, 2025, https://en.wikipedia.org/wiki/Iringa_Region
- iringayetublog.wordpress.com, accessed March 30, 2025, https://iringayetublog.wordpress.com/economic-activities/#:~:text=Iringa’s%20economy%20is%20dependent%20on,)%2C%20lumber%20production%20and%20tourism.
- Economic Activity – Iringa Yetu – WordPress.com, accessed March 30, 2025, https://iringayetublog.wordpress.com/economic-activities/
- Njombe Region – Wikipedia, accessed March 30, 2025, https://en.wikipedia.org/wiki/Njombe_Region
- en.wikipedia.org, accessed March 30, 2025, https://en.wikipedia.org/wiki/Njombe_Region#:~:text=The%20agricultural%20industry%20dominates%20the,and%2045.2%20percent%20in%202019.
- kilimanjaro.go.tz, accessed March 30, 2025, https://kilimanjaro.go.tz/storage/app/media/uploaded-files/Kilimanjaro_Investement_Guide_2018.pdf
- Kilimanjaro Region Investment Guide – TanzaniaInvest, accessed March 30, 2025, https://www.tanzaniainvest.com/economy/kilimanjaro-region-investment-guide
- www.exploretanzaniatours.com, accessed March 30, 2025, https://www.exploretanzaniatours.com/arusha-city-the-geneva-of-africa/#:~:text=Agriculture%20and%20tourism%20are%20Arusha’s,important%20agricultural%20products%20in%20Arusha.
- Arusha City – The Geneva of Africa – Explore Tanzania Tours, accessed March 30, 2025, https://www.exploretanzaniatours.com/arusha-city-the-geneva-of-africa/
- www.tanzaniainvest.com, accessed March 30, 2025, https://www.tanzaniainvest.com/economy/manyara-region-investment-guide#:~:text=Agricultural%20production%2C%20livestock%20keeping%2C%20and,economic%20activities%20in%20Manyara%20Region.
- Manyara Region Investment Guide – TanzaniaInvest, accessed March 30, 2025, https://www.tanzaniainvest.com/economy/manyara-region-investment-guide
- Manyara Region – Domestic Tourism Safaris, accessed March 30, 2025, https://domestictourismsafaris.co.tz/manyara-region/
- Tanga Region Investment Guide – TanzaniaInvest, accessed March 30, 2025, https://www.tanzaniainvest.com/economy/tanga-region-investment-guide
- Tanga Region – Wikipedia, accessed March 30, 2025, https://en.wikipedia.org/wiki/Tanga_Region
- Mwanza Region – Wikipedia, accessed March 30, 2025, https://en.wikipedia.org/wiki/Mwanza_Region
- en.wikipedia.org, accessed March 30, 2025, https://en.wikipedia.org/wiki/Mwanza_Region#:~:text=average%20of%2027.69.-,Agriculture,the%20economy%20of%20Mwanza%20Region.
- Mwanza City – MITU, accessed March 30, 2025, https://mitu.or.tz/mwanza-city/
- Mwanza’s grows its lakeside economy – The EastAfrican, accessed March 30, 2025, https://www.theeastafrican.co.ke/tea/business-tech/mwanza-s-grows-its-lakeside-economy-1406630
- morogoro.go.tz, accessed March 30, 2025, https://morogoro.go.tz/storage/app/media/uploaded-files/MOROGORO%20REGIONAL%20GDP%20REPORT%202022.pdf
- Morogoro Region – Wikipedia, accessed March 30, 2025, https://en.wikipedia.org/wiki/Morogoro_Region
- Economic Activities | Morogoro District Council, accessed March 30, 2025, https://www.morogorodc.go.tz/index.php/en/economic-activities